
VS Code debugging
Debugging is the process of finding and fixing bugs in your code.
VS Code has a powerful debugger built in, which allows you to set breakpoints, step through your code, and inspect variables.
This is a very powerful tool for understanding how your code works, and for finding and fixing bugs.
If you don’t have a project set up for debugging, you can just download the following simple Java file.
Place this file in a new folder, and open the folder in VS Code.
Otherwise, you can use your own project.
Setting up your project for debugging
To use the debugger, you need to have a launch.json file in your .vscode folder.
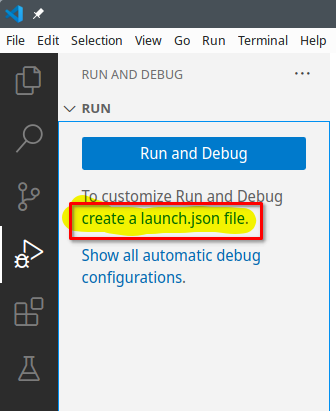
Open the Run and Debug view by clicking the “Run” icon in the activity bar on the side:

If you don’t have a launch.json file, you can click the “create a launch.json file” link in the Run view:
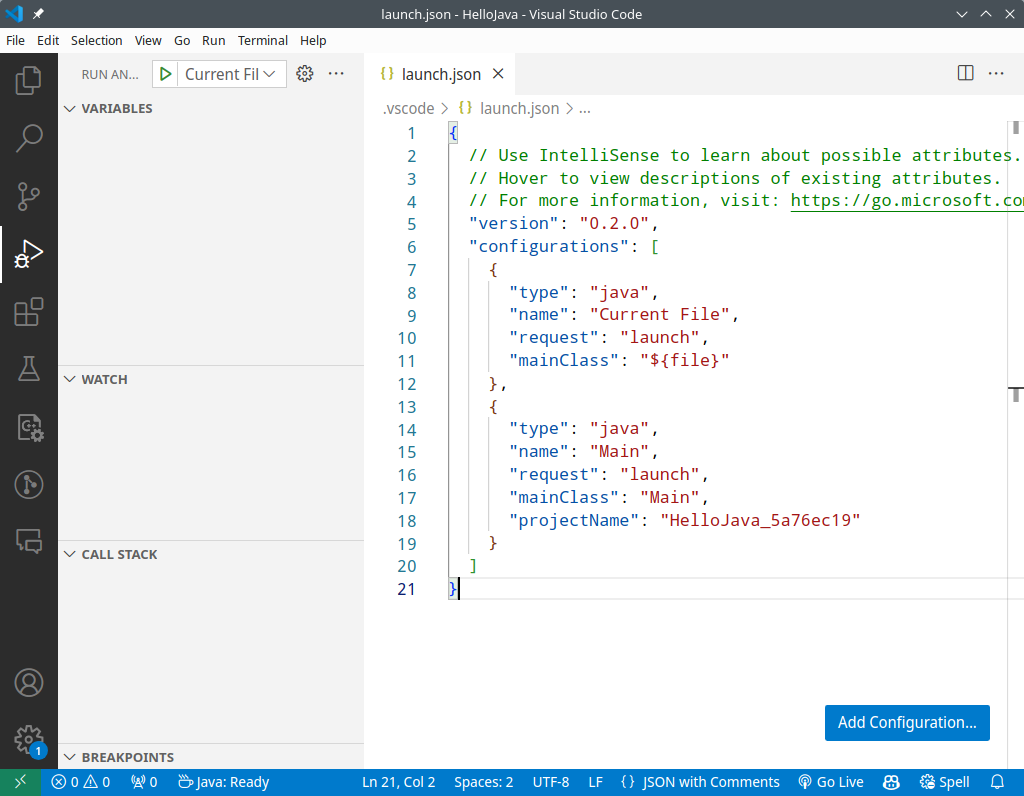
This creates a launch.json file in your .vscode folder, with a configuration for your project:
One useful attribute to add to the launch.json file is the args attribute, which allows you to pass command-line arguments to your program if you need to:
"configurations": [
  {
    ...
    "args": ["How", "are", "you?"],
    ...
  }
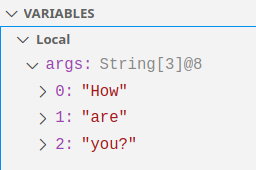
You can then see the values of these arguments in the Variables view when you are debugging, in this case three strings in the args variable:
If you want it as a single string, you might try something like this:
"configurations": [
  {
    ...
    "args": ["How are you?"]
    ...
  }
But you might still see it as separate strings, due to “word splitting” carried out by the shell (i.e., just like if you were to run the program from the command line).
You would therefore need to use double quotes to group the words together:
"configurations": [
  {
    ...
    "args": ["\"How are you?\""]
    ...
  }
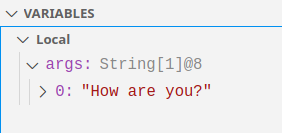
This will then be seen as a single string in the args variable when debugging:
You can close the launch.json file if you don’t want to change anything, and then you can start debugging!
Running the debugger
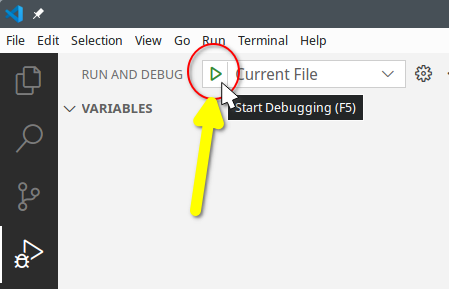
To run the debugger, you can click the “Start Debugging” button in the Run view, or press F5:
This will start the debugger. However, we don’t have any breakpoints set, so the program will just run to completion.
So, let’s set a breakpoint!
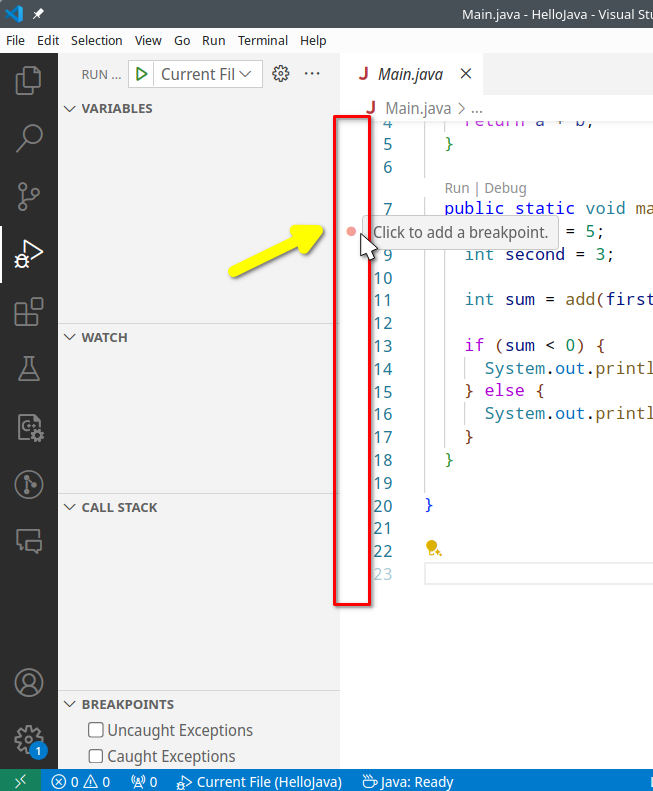
Hover over the line number where you want to set a breakpoint, and click the red dot that appears:
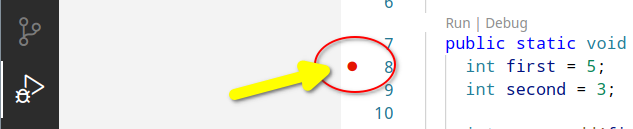
When you remove the mouse, you will see a red dot on the line number:
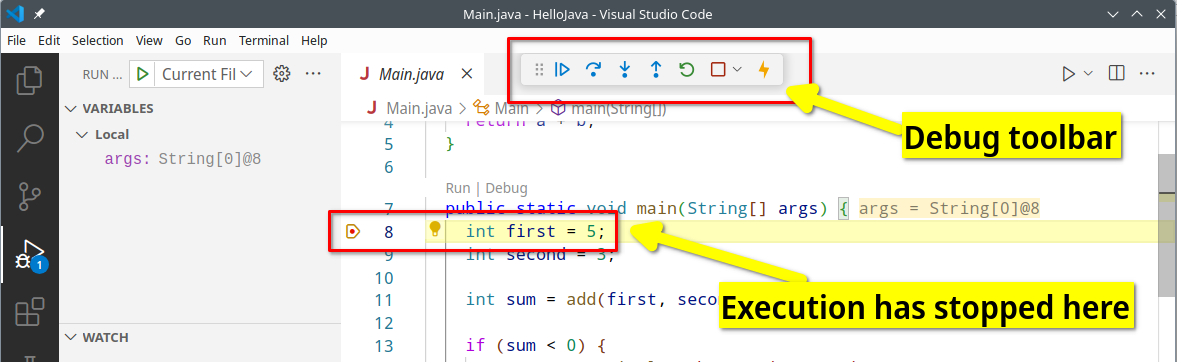
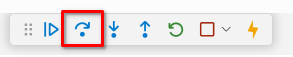
Now, when you run the debugger again, it will stop at this line. There’s also a Debug toolbar at the top of the window, which allows you to step through the code, continue running, or stop the debugger:
From the Debug toolbar, press the Step Over button, or press F10:
The debugger will move to the next line. Keep pressing the Step Over button a few more times to see the debugger move through the code.
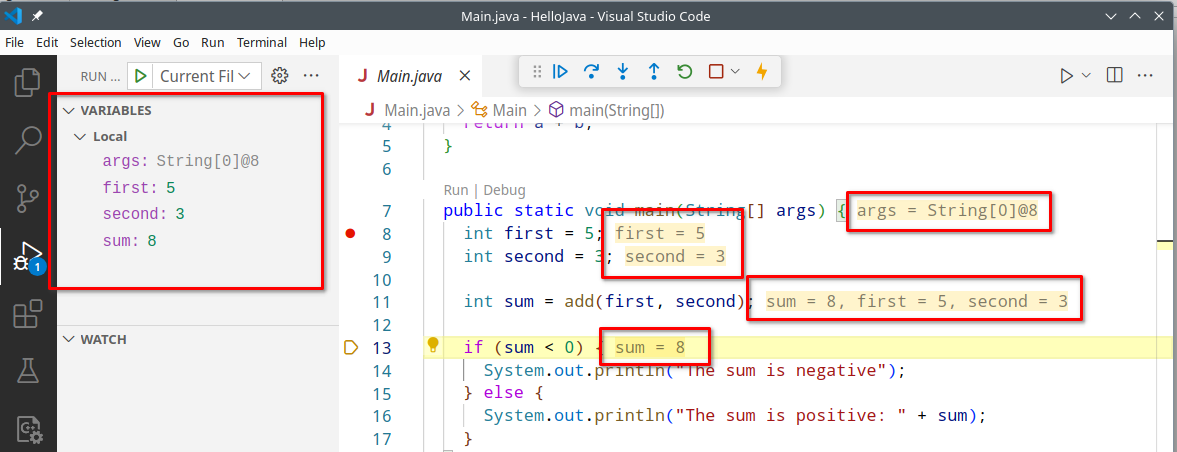
You will notice that the Variables view updates as you step through the code, showing the values of variables at each step. They are also shown inline in the code:
The buttons on the Debug toolbar are:
- Continue (or F5): Continue running the program until the next breakpoint
- Step Over (or F10): Step over the current line of code
- Step Into (or F11): Step into the current line of code
- Step Out (or Shift + F11): Step out of the current method
- Restart (or Ctrl + Shift + F5): Restart the debugger
- Stop (or Shift + F5): Stop the debugger
Watch expressions
You can also add watch expressions to the Watch view, which will show the value of an expression at each step. You can write any valid Java expression (e.g., args.length or sum == 0), and it will be evaluated depending on the current state of the program.
To add a watch expression, click the + button in the Watch view:

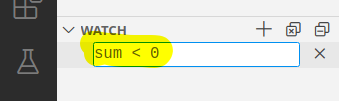
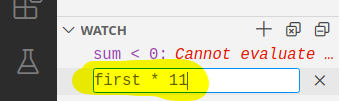
Now type an expression, such as sum < 0:
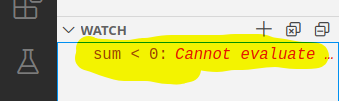
Now press Enter, and you will see the value of the expression. In this case, it says “Cannot evaluate because of compilation error”. That’s because the sum variable hasn’t been declared yet based on where the debugger is currently paused:
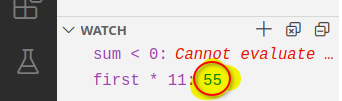
Let’s add another watch expression, first * 11:
Since first is currently 5, this will evaluate to 55:
Breakpoints
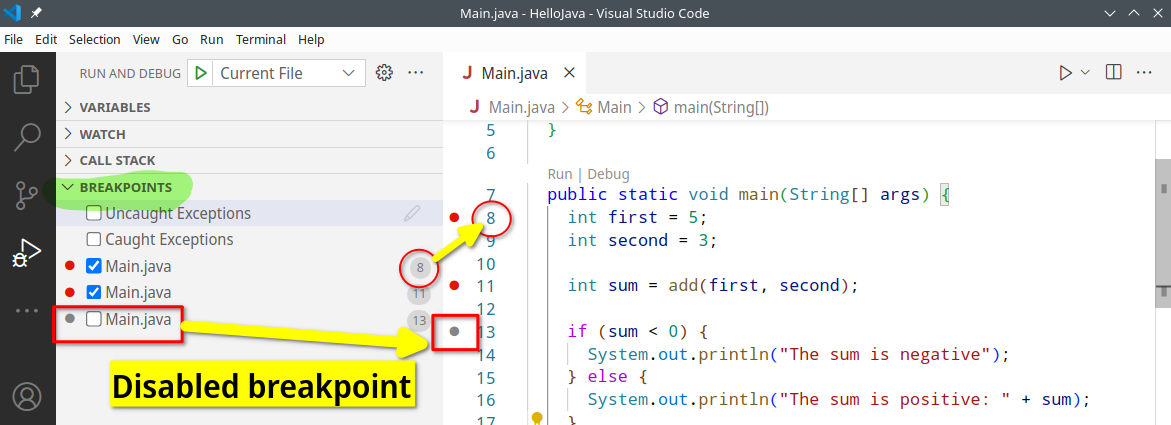
You can set multiple breakpoints in your code, and the debugger will stop at each one.
Each one is added to the Breakpoints view inside the Run and Debug view, and you can enable or disable them by clicking the checkbox next to each one rather than removing them:
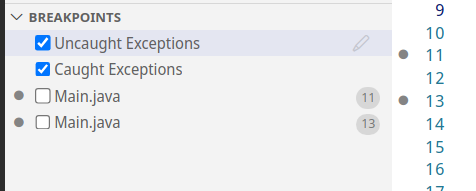
You can also make use of the Exceptions-based breakpoints, which allow you to stop the debugger when an uncaught or caught exception is thrown. This can be useful for finding and fixing bugs in your code, especially if you’re not sure where the exception is being thrown:
Debugging for the Test Cases in the Assignments
For the assignments, if you want to debug a test case, you can do so as follows.
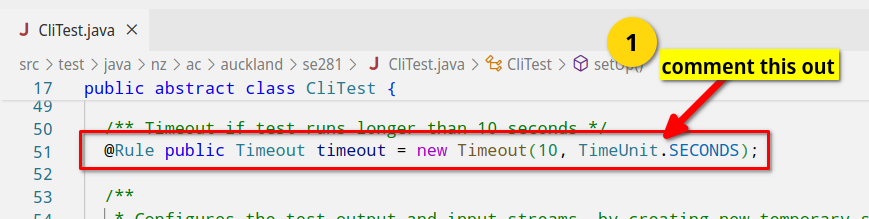
First of all, the test cases are set up to time out after 10 seconds (i.e., if the test case takes longer than 10 seconds to run, it will fail). This is to prevent infinite loops from causing the test cases to hang indefinitely.
For your own purposes, you can remove this timeout (otherwise you won’t have enough time to debug the test case).
Go to CliTest.java and remove or comment out the following line:
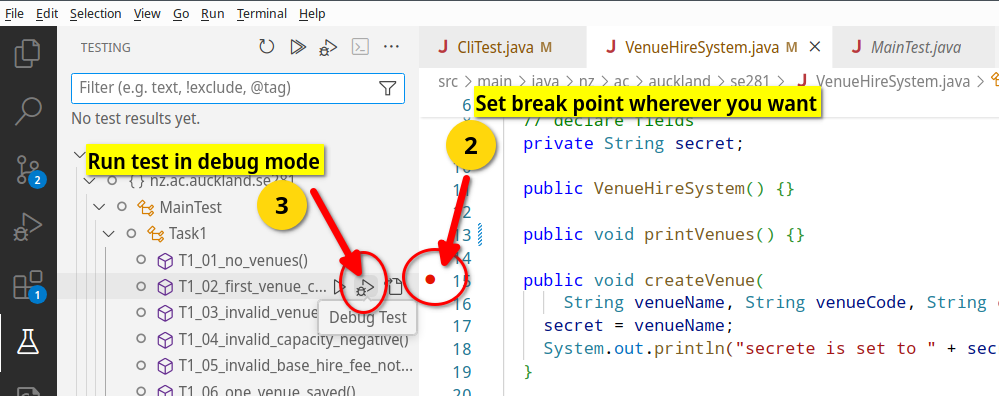
Then set your breakpoint(s) as usual, wherever your feel you need them, and click the Debug Test button fir the test case you are interested in:
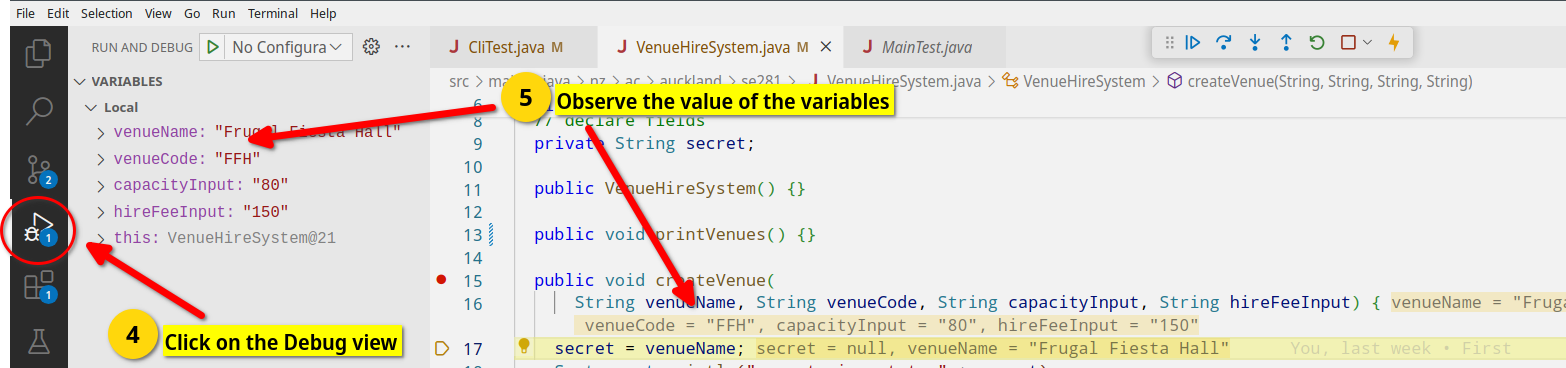
And now you can debug the test case as you would any other program in the Debug view:
More VS Code guides
Check out the other VS Code guide pages: